
What Was the Dixie Fire?
The Dixie Fire was one of the most destructive wildfires in the history of California and the largest single (non-complex) wildfire ever recorded in the state.
- Start Date: July 13, 2021
- Contained: October 25, 2021
- Area Burned: 963,309 acres
- Location: Northern California (Butte, Plumas, Lassen, Tehama, and Shasta counties)
The fire ignited in the Feather River Canyon near Cresta Dam in Butte County and rapidly spread due to dry vegetation, extreme heat, and gusty winds. It eventually merged into a firestorm, crossing mountain ranges and threatening multiple towns.
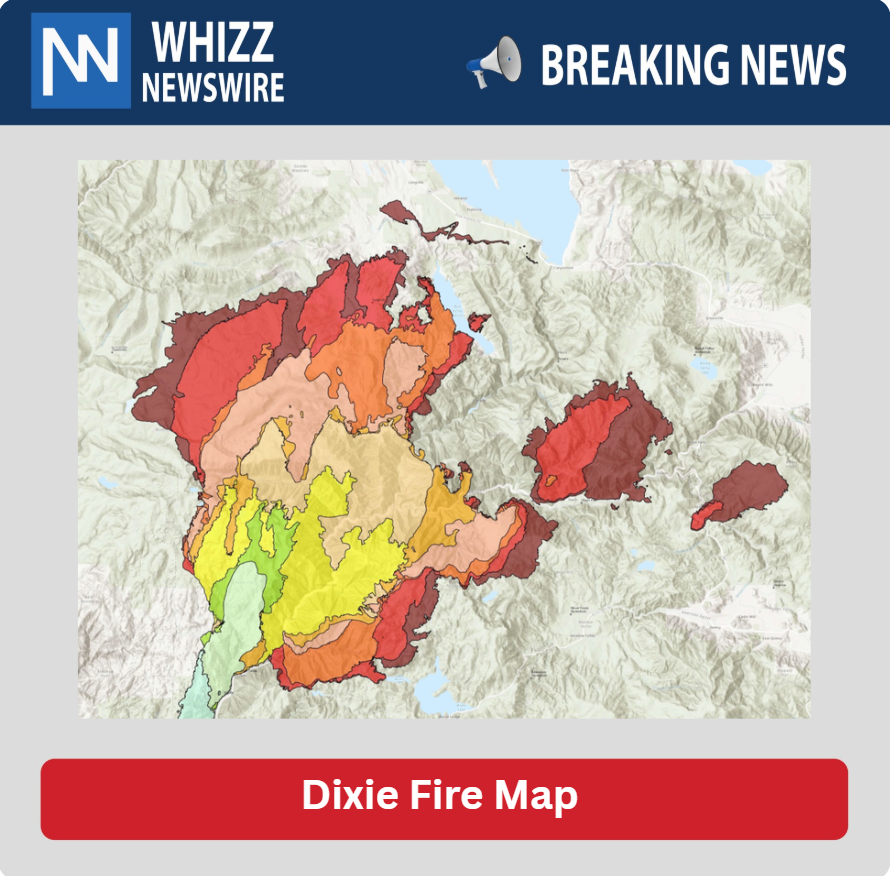
Understanding the Dixie Fire Map
A wildfire map is more than just a tool, it’s a lifeline during a crisis. The Dixie Fire map was essential for:
- Real-time evacuation planning
- Firefighting operations
- Damage assessment
- Post-fire ecological recovery
Main Components of the Map:
- Fire Perimeter
- The outer edge of the burned area is marked with bold red or orange lines.
- Updated daily by satellite and aerial infrared imaging.
- The outer edge of the burned area is marked with bold red or orange lines.
- Hotspots / Active Flames
- Represented by red dots or flame icons on many maps.
- These show where the fire is still burning or flaring up.
- Represented by red dots or flame icons on many maps.
- Evacuation Zones
- Color-coded regions showing mandatory evacuation, evacuation warnings, or safe zones.
- Color-coded regions showing mandatory evacuation, evacuation warnings, or safe zones.
- Burn Severity Zones
- Post-fire maps show:
- High severity: Blackened areas with total vegetation loss.
- Moderate severity: Some tree trunks standing.
- Low severity: Ground burned, canopy intact.
- High severity: Blackened areas with total vegetation loss.
- These help assess soil damage, erosion risk, and wildlife impact.
- Post-fire maps show:
- Road Closures and Infrastructure Damage
- Important for residents returning to their homes or planners repairing public services.
- Important for residents returning to their homes or planners repairing public services.
Timeline of Fire Spread (as seen on maps)
Here’s a breakdown of how the fire expanded and how the map changed over time:
Week 1 (July 13–20, 2021)
- Ignition point near Cresta Dam in Butte County.
- Fire moved northeast into the Plumas National Forest.
- Immediate evacuations were ordered in nearby towns like Concow and Jarbo Gap.
Week 2–3 (Late July)
- The fire doubled in size within days.
- Crossed into Plumas County and threatened the town of Greenville.
- The fire perimeter ballooned to hundreds of square miles.
August 4, 2021 – Destruction of Greenville
- The historic town of Greenville was almost entirely destroyed.
- Map data showed a concentrated high-severity burn in this region.
- Over 75% of structures were lost.
August–September
- Fire continued expanding into Lassen Volcanic National Park and Shasta County.
- Satellite maps showed:
- Over 700 miles of fire lines were constructed by crews.
- Multiple fire fronts threatening different towns at once.
- Over 700 miles of fire lines were constructed by crews.
October 25, 2021 – Full Containment
- After burning for over 100 days, the fire was declared contained.
- Burn scar maps showed massive ecological damage, especially in steep and forested areas.
Damage Assessment (As Seen on Map Layers)
Using post-fire satellite imaging, officials assessed damage by overlaying:
- Structure loss zones: Highlighting over 1,329 structures destroyed.
- Utility damage: Powerlines, roads, water systems affected.
- Soil burn severity maps: Determining where replanting, erosion control, and reseeding would be needed.
Maps were made public via:
- CAL FIRE
- NASA FIRMS (Fire Information for Resource Management System)
- USFS (U.S. Forest Service)
- Google Crisis Maps
- Esri Wildfire Mapping
Dixie Fire Stats at a Glance
| Metric | Details |
| Total Area Burned | 963,309 acres (~1,500 sq miles) |
| Affected Counties | 5 (Butte, Plumas, Tehama, Lassen, Shasta) |
| Structures Destroyed | Over 1,300 homes and buildings |
| Firefighters Deployed | 6,500+ at peak response |
| Cause | PG&E equipment failure (tree contact with power lines) |
| Damage Cost | Estimated over $637 million |
| Fatalities | 1 firefighter, multiple injuries |
Environmental & Ecological Mapping
After the fire, scientists used maps to evaluate:
- Tree mortality and future fire fuel buildup
- Wildlife habitat destruction (particularly deer, bear, and spotted owl ranges)
- Watershed contamination risks
- Erosion risk mapping (to prioritize where to place barriers or plant vegetation)
Restoration maps were created for:
- Reforestation
- Trail repair (e.g., Lassen Park)
- Soil stabilization
How the Map Helped in Recovery
Dixie Fire maps played a vital role in recovery planning. Agencies used digital mapping systems to:
- Identify which towns needed FEMA emergency funds
- Map hazard tree removal zones
- Monitor illegal dumping or squatting in burn scars
- Guide mental health support services to communities most affected
Some local governments even developed interactive maps where residents could:
- Check if their property was affected
- Apply for rebuilding permits
- Get updates on road access
Where to Find the Map
If you’re looking for the live or archived maps, here are reliable sources:
- CAL FIRE Incident Map
- Offers real-time updates, fire perimeters, and evacuation zones.
- Offers real-time updates, fire perimeters, and evacuation zones.
- InciWeb – Dixie Fire
- Government-run fire incident info with daily map PDFs.
- Government-run fire incident info with daily map PDFs.
- NASA FIRMS Satellite Maps
- See heat signatures and active burning areas.
- See heat signatures and active burning areas.
- [Google Crisis Map (Archived)]
- Public evacuation zones and active fire paths (during 2021 event).
- Public evacuation zones and active fire paths (during 2021 event).
- Esri Wildfire StoryMaps
- Interactive GIS dashboards with visuals and timelines.
- Interactive GIS dashboards with visuals and timelines.
Final Thoughts
The Dixie Fire map was not just a line on a screen it told a story of destruction, survival, and resilience. It helped firefighters fight smarter, allowed residents to evacuate in time, guided relief agencies, and now plays a key role in restoring the land and rebuilding communities.
From red hot zones to green restoration targets, each layer of the map is a chapter in the tale of one of America’s most historic wildfires.